Live case study · Google Discover management
From 1,342 to 220,042 Discover clicks a month: a running and fitness publisher after PIB started
Discover clicks, before and after
The month before PIB took over
Nov 2025
1,342
Discover clicks that month
Best full month so far
Sep 2026
220,042
Discover clicks that month
Estimated revenue at a $30 to $50 RPM
Nov 2025$40 to $67→Sep 2026$6.6K to $11.0K
Hover or tap: estimate only. Clicks times a $30 to $50 RPM. Your RPM may be higher or lower.
An established running and fitness publisher with a daily news operation, and what Google Discover sent it month by month after PIB started work under Google Discover management.
Source: Google Search Console, Discover report, to 27 October 2026. Revenue is an estimate at $30 to $50 RPM. Notes
How many Discover clicks did the site get each month?
Short answer: In September 2026 the publisher got 220,042 Discover clicks, up from 1,342 in November 2025, the month before PIB started. That is an estimated $6.6K to $11.0K. October is higher so far (246,154 clicks) but covers 1 to 27 October only.
Discover clicks by month
Hover, tap or tab to a month for exact figures.
- Est. revenue
- $6.6K to $11.0K
- Impressions
- 6,174,202
- CTR
- 3.56%
| Month | Clicks | Impressions | CTR | Estimated revenue |
|---|---|---|---|---|
| Nov 2025 | 1,342 | 19,069 | 7.04% | $40 to $67 |
| Dec 2025 | 46 | 804 | 5.72% | $1 to $2 |
| Jan 2026 | 14 | 360 | 3.89% | $0 to $1 |
| Feb 2026 | 2,366 | 40,771 | 5.80% | $71 to $118 |
| Mar 2026 | 55,752 | 505,643 | 11.03% | $1.7K to $2.8K |
| Apr 2026 | 21,498 | 408,347 | 5.26% | $0.6K to $1.1K |
| May 2026 | 40,531 | 765,222 | 5.30% | $1.2K to $2.0K |
| Jun 2026 | 206,078 | 2,830,391 | 7.28% | $6.2K to $10.3K |
| Jul 2026 | 82,978 | 1,695,898 | 4.89% | $2.5K to $4.1K |
| Aug 2026 | 142,377 | 3,492,988 | 4.08% | $4.3K to $7.1K |
| Sep 2026 | 220,042 | 6,174,202 | 3.56% | $6.6K to $11.0K |
| Oct 2026 (1 to 27 Oct only) | 246,154 | 10,552,116 | 2.33% | $7.4K to $12.3K |
What does Search Console show?
The Discover report for 1 November 2025 to 27 October 2026, then the same export by week. Hover, tap or tab a week for exact figures. Toggle between clicks and estimated revenue.
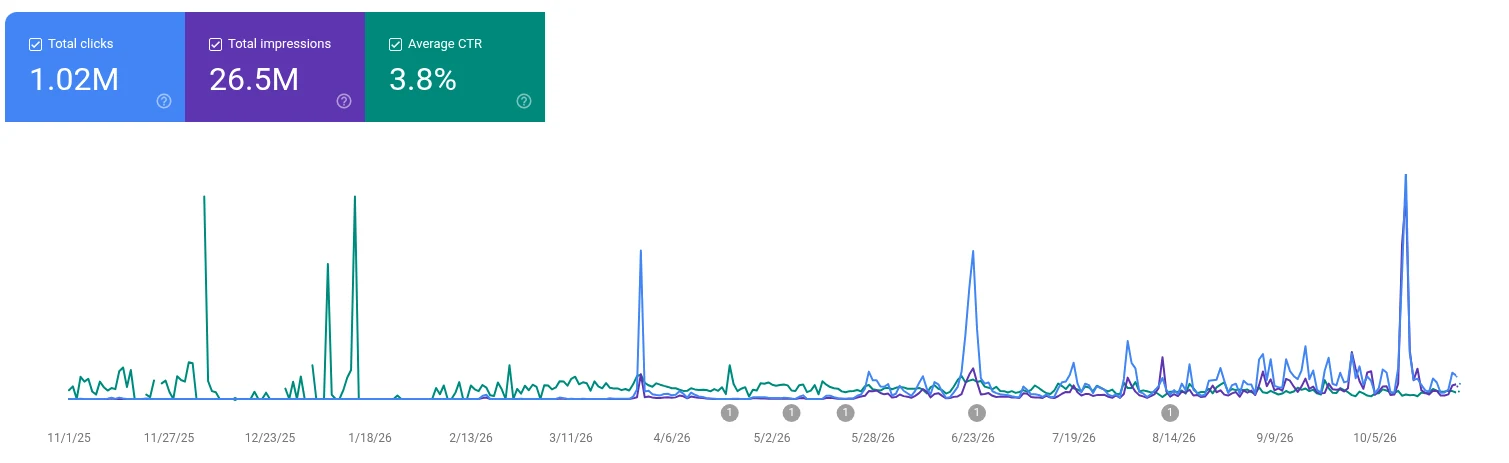
Google Search Console, Discover report, 1 November 2025 to 27 October 2026: 1.02M clicks, 26.5M impressions, 3.8% average CTR as Search Console shows it. Site details are removed.
Discover clicks by week
Hover, tap or tab to a week for exact figures. Partial weeks (under 7 days) are marked.
- Est. revenue
- $4.3K to $7.1K
- Impressions
- 7,283,419
- Peak day
- 70,848
- CTR
- 1.96%
The three tallest weeks: 143K (Week of Oct 12), 120K (Week of Jun 22) and 56K (Week of Sep 14).
| Week | Clicks | Impressions | CTR | Estimated revenue | Peak day |
|---|---|---|---|---|---|
| Week of Nov 1 (2 days) | 4 | 85 | 4.71% | $0 to $0 | 3 |
| Week of Nov 3 | 140 | 1,623 | 8.63% | $4 to $7 | 85 |
| Week of Nov 10 | 1,112 | 14,032 | 7.92% | $33 to $56 | 427 |
| Week of Nov 17 | 61 | 3,064 | 1.99% | $2 to $3 | 54 |
| Week of Nov 24 | 25 | 265 | 9.43% | $1 to $1 | 16 |
| Week of Dec 1 | 16 | 145 | 11.03% | $0 to $1 | 7 |
| Week of Dec 8 | 10 | 264 | 3.79% | $0 to $1 | 9 |
| Week of Dec 15 | 3 | 109 | 2.75% | $0 to $0 | 3 |
| Week of Dec 22 | 7 | 170 | 4.12% | $0 to $0 | 6 |
| Week of Dec 29 | 11 | 142 | 7.75% | $0 to $1 | 6 |
| Week of Jan 5 | 7 | 137 | 5.11% | $0 to $0 | 4 |
| Week of Jan 12 | 5 | 83 | 6.02% | $0 to $0 | 2 |
| Week of Jan 19 | 1 | 79 | 1.27% | $0 to $0 | 1 |
| Week of Jan 26 | 0 | 35 | 0.00% | $0 to $0 | 0 |
| Week of Feb 2 | 12 | 370 | 3.24% | $0 to $1 | 4 |
| Week of Feb 9 | 30 | 675 | 4.44% | $1 to $2 | 16 |
| Week of Feb 16 | 2,251 | 37,558 | 5.99% | $68 to $113 | 1,301 |
| Week of Feb 23 | 83 | 2,310 | 3.59% | $2 to $4 | 43 |
| Week of Mar 2 | 460 | 5,324 | 8.64% | $14 to $23 | 440 |
| Week of Mar 9 | 453 | 5,212 | 8.69% | $14 to $23 | 236 |
| Week of Mar 16 | 267 | 4,774 | 5.59% | $8 to $13 | 128 |
| Week of Mar 23 | 49,731 | 424,115 | 11.73% | $1.5K to $2.5K | 45,832 |
| Week of Mar 30 | 11,794 | 172,730 | 6.83% | $354 to $590 | 2,543 |
| Week of Apr 6 | 10,198 | 215,415 | 4.73% | $306 to $510 | 2,401 |
| Week of Apr 13 | 1,963 | 44,150 | 4.45% | $59 to $98 | 792 |
| Week of Apr 20 | 224 | 4,049 | 5.53% | $7 to $11 | 101 |
| Week of Apr 27 | 3,072 | 50,707 | 6.06% | $92 to $154 | 570 |
| Week of May 4 | 2,949 | 43,031 | 6.85% | $88 to $147 | 1,137 |
| Week of May 11 | 2,134 | 33,416 | 6.39% | $64 to $107 | 1,018 |
| Week of May 18 | 2,280 | 50,263 | 4.54% | $68 to $114 | 997 |
| Week of May 25 | 32,246 | 625,884 | 5.15% | $1.0K to $1.6K | 8,448 |
| Week of Jun 1 | 16,675 | 301,977 | 5.52% | $500 to $834 | 4,629 |
| Week of Jun 8 | 28,957 | 600,070 | 4.83% | $0.9K to $1.4K | 7,029 |
| Week of Jun 15 | 37,043 | 462,475 | 8.01% | $1.1K to $1.9K | 19,885 |
| Week of Jun 22 | 120,147 | 1,399,019 | 8.59% | $3.6K to $6.0K | 45,674 |
| Week of Jun 29 | 7,823 | 197,569 | 3.96% | $235 to $391 | 1,810 |
| Week of Jul 6 | 12,920 | 312,485 | 4.13% | $388 to $646 | 3,885 |
| Week of Jul 13 | 33,680 | 585,082 | 5.76% | $1.0K to $1.7K | 11,190 |
| Week of Jul 20 | 24,920 | 476,655 | 5.23% | $0.7K to $1.2K | 4,817 |
| Week of Jul 27 | 30,970 | 598,544 | 5.17% | $0.9K to $1.5K | 17,882 |
| Week of Aug 3 | 29,294 | 553,750 | 5.29% | $0.9K to $1.5K | 11,135 |
| Week of Aug 10 | 23,594 | 1,197,763 | 1.97% | $0.7K to $1.2K | 6,484 |
| Week of Aug 17 | 26,049 | 537,609 | 4.85% | $0.8K to $1.3K | 10,712 |
| Week of Aug 24 | 37,762 | 761,911 | 4.96% | $1.1K to $1.9K | 9,580 |
| Week of Aug 31 | 43,884 | 1,090,899 | 4.02% | $1.3K to $2.2K | 13,905 |
| Week of Sep 7 | 50,219 | 1,521,313 | 3.30% | $1.5K to $2.5K | 12,301 |
| Week of Sep 14 | 56,054 | 1,261,347 | 4.44% | $1.7K to $2.8K | 16,298 |
| Week of Sep 21 | 45,545 | 979,756 | 4.65% | $1.4K to $2.3K | 12,739 |
| Week of Sep 28 | 52,948 | 2,625,422 | 2.02% | $1.6K to $2.6K | 13,991 |
| Week of Oct 5 | 36,060 | 940,919 | 3.83% | $1.1K to $1.8K | 9,589 |
| Week of Oct 12 | 142,567 | 7,283,419 | 1.96% | $4.3K to $7.1K | 70,848 |
| Week of Oct 19 | 28,634 | 709,251 | 4.04% | $0.9K to $1.4K | 8,131 |
| Week of Oct 26 (2 days) | 11,884 | 348,360 | 3.41% | $357 to $594 | 7,237 |
Key facts
- 220,042Discover clicks in September 2026, the best full monthBest full calendar month. October is higher so far but covers 1 to 27 Oct only.
- 10 weeksroughly, from kickoff to the first breakout article, 2,200+ clicks in two daysKickoff 10 Dec 2025. First breakout 16 to 17 Feb 2026.
- April 2026first month with no zero-click dayFrom 1 Apr 2026 no day had zero Discover clicks.
- June 2026first month over 100,000 clicks, the seventh month after kickoffJune was the first month over 100,000 Discover clicks.
Discover clicks, April to September 2026
21KApr41KMay206KJun83KJul142KAug220KSepThe last six full months. Clicks arrive in bursts, so single months move a lot.
Share of Discover clicks, by page
- Top 1 page11.1%
- Top 1035.4%
- Top 5061.1%
- Top 10075.5%
960 pages earned Discover clicks. The median page earned 139.
Where the clicks came from
- United States47%
- United Kingdom22%
- South Africa7%
- Canada4%
- Australia4%
- 1.02MDiscover clicks, 1 Nov 2025 to 27 Oct 2026Sum of every month in the Search Console export, including the partial October.
- 26.5MDiscover impressions over the same periodImpressions grew faster than clicks across the period.
- 3.8%average click-through rate over the periodAs Search Console shows it for the full export window.
- 470,141Discover clicks in the 13 weeks to 5 October 2026Weekly totals built from the daily Search Console data.
Month by month
One card a month, same definitions every time. Estimated revenue is clicks at a $30 to $50 RPM.
Nov 2025
Month before PIB1,342Discover clicks- Est. revenue
- $40 to $67
- Impressions
- 19,069, CTR 7.04%
- What happened
- The month before PIB. The biggest day had 427 clicks.
Dec 2025
Kickoff46Discover clicks- Est. revenue
- $1 to $2
- Impressions
- 804, CTR 5.72%
- What happened
- Kickoff on 10 December. The technical and content review followed on 22 December.
Jan 2026
14Discover clicks- Est. revenue
- $0 to $1
- Impressions
- 360, CTR 3.89%
- What happened
- We recommended clean-up, editorial tools and a content testing plan.
Feb 2026
2,366Discover clicks- Est. revenue
- $71 to $118
- Impressions
- 40,771, CTR 5.80%
- What happened
- Google updated Discover on 5 February. A news article led the first breakout, 2,226 Discover clicks on 16 and 17 February.
Mar 2026
55,752Discover clicks- Est. revenue
- $1.7K to $2.8K
- Impressions
- 505,643, CTR 11.03%
- What happened
- One day, 29 March, produced 45,832 clicks, 82% of the month.
Apr 2026
21,498Discover clicks- Est. revenue
- $0.6K to $1.1K
- Impressions
- 408,347, CTR 5.26%
- What happened
- No day had zero clicks from 1 April.
May 2026
40,531Discover clicks- Est. revenue
- $1.2K to $2.0K
- Impressions
- 765,222, CTR 5.30%
- What happened
- Clicks nearly doubled from April, from 21,498 to 40,531.
Jun 2026
206,078Discover clicks- Est. revenue
- $6.2K to $10.3K
- Impressions
- 2,830,391, CTR 7.28%
- What happened
- The seventh month after the December kickoff. Four days, 21 to 24 June, made 121,451 clicks, 59% of the month. The first month over 100,000.
Jul 2026
82,978Discover clicks- Est. revenue
- $2.5K to $4.1K
- Impressions
- 1,695,898, CTR 4.89%
- What happened
- 82,978 clicks, 60% below June.
Aug 2026
142,377Discover clicks- Est. revenue
- $4.3K to $7.1K
- Impressions
- 3,492,988, CTR 4.08%
- What happened
- Up 72% on July.
Sep 2026
Best full month220,042Discover clicks- Est. revenue
- $6.6K to $11.0K
- Impressions
- 6,174,202, CTR 3.56%
- What happened
- The best full month so far, up 55% on August.
Oct 2026
1 to 27 Oct only246,154Discover clicks, 1 to 27 October- Est. revenue
- $7.4K to $12.3K
- Impressions
- 10,552,116, CTR 2.33%
- What happened
- Three days, 12 to 14 October, made 123,424 clicks, about half of the month so far.
Over the twelve months to 27 October 2026 the report shows 1,019,178 Discover clicks from 26,485,811 impressions, a 3.85% click-through rate. At $30 to $50 RPM that is an estimated $30.6K to $51.0K, including $7.4K to $12.3K for the first 27 days of October.
Key dates
Agreement signed on 27 Nov 2025. Kickoff followed on 10 Dec.
What the shape tells us
- The first three months. December to February produced 2,426 Discover clicks in total.
- Spikes carry some months. One day made 82% of March and four days made 59% of June.
- A rising floor. From 1 April to 27 October 2026 no day had zero clicks, and the median day was 2,522 clicks, with 17 days under 100 clicks.
- A build after June. August and September each beat the month before: 142,377, then 220,042.
- Impressions grew faster than clicks. Impressions rose from 3,492,988 in August to 6,174,202 in September, while CTR went from 4.08% to 3.56%.
- 13 weeks (5 July to 5 October 2026): 470,141 clicks, 12,582,451 impressions, 3.74% CTR, about 157,000 clicks a month on average.
How much Discover traffic can a running and fitness site get?
Short answer: In September 2026, this anonymous running and fitness publisher got 220,042 Discover clicks in a month, up from 1,342 in the month before PIB started. That is an estimated $6.6K to $11.0K at a $30 to $50 RPM.
The site was technically sound. Discover was the channel it had not yet built. The early work went into content, titles, indexing and early-engagement testing.
Where did the publisher start before PIB?
Short answer: With some Discover spikes and no steady flow. In November 2025, the month before kickoff, Search Console shows 1,342 Discover clicks from 19,069 impressions. Then 46 clicks in December and 14 in January.
The biggest November day was 427 clicks. The agreement was signed on 27 November 2025 and kickoff was 10 December 2025. We started with a Search Console audit and a call with the founder and the lead editor. Two worries came up straight away:
- Workload. The writing team was small, and one person handled most daily stories. The work had to fit inside the existing editorial process, not add a second production line.
- Google's recent updates. The team had seen Discover visibility move around and wanted a plan, not guesses.
December to February produced 2,426 clicks in total.
What did PIB do to get Discover traffic?
Short answer: We reviewed the site first, cleaned up what diluted it, gave the editors tools to test the titles and images Discover leans on, and set a testing plan. The first breakout article came about ten weeks in. After that we kept testing angles and watched Search Console.
December 2025: a review before anything else
Twelve days after kickoff we delivered a technical and content review. The headlines:
- Technically the site was in good shape. Nothing critical stood in the way of Discover.
- Author credibility signals could be stronger: structured data linking authors to their profiles, and fuller bios.
- A set of thin and blank pages was indexed, which diluted the site's quality signals.
- Some articles sat outside the site’s core topic.
January 2026: clean-up, tools and a testing plan
- Indexing and relevance. We recommended that thin pages be fixed and that off-topic articles be removed or redirected to the closest relevant page.
- Authority signals. We recommended author structured data and fuller bios.
- Editorial tooling. We supplied a tool to draft and test the preview titles and images that Discover leans on, plus a feed of what the site's audience discusses online.
- A content testing plan. We set out about 30 article ideas in four tiers, seven reusable page structures and a pre-publish checklist. It favoured personal, specific stories over generic advice.
January 2026 itself produced 14 Discover clicks.
February 2026: a Google update and the first breakout
Google released a core update to Discover on 5 February 2026, covering local relevance, less clickbait and topic-level expertise. We briefed the publisher the next day and recommended staying inside its areas of genuine expertise and keeping headlines compelling but accurate.
On 16 and 17 February a news article produced more than 2,200 Discover clicks, the first article of its kind for the publisher. The Discover report shows 925 and 1,301 clicks on the two days, 2,226 in all. We cannot say whether the Google update, the title work or the topic did it. The month closed with 2,366 clicks. We then gave the team an early-engagement plan for the next test articles:
- publish at the hours when the US audience is most active
- keep the article pinned on the homepage for two to three days
- add internal links in the first 24 hours
- make sure the lead image is at least 1,200 pixels wide
- consider push notifications and Google Web Stories as longer-term tests
March to October 2026: test, learn, keep going
We kept testing angles with the editors and watched Search Console for what Discover rewarded.
What is the Discover traffic made of?
Short answer: Mostly stories, not guides. 960 pages earned Discover clicks over the period. The top 10 pages earned 35.4% of them and the top 100 earned 75.5%.
- Stories, not guides. The 25 pages with the most Discover clicks are all news or human-interest stories: elite race performances and records, a story from a major race, an offbeat race story, personal profiles and a few safety stories. Evergreen comparison guides first appear around the 44th page.
- Concentration. 171 pages earned 1,000 clicks or more. The median page earned 139.
- Audience. 47% of Discover clicks came from the US, 22% from the UK and 7% from South Africa. Canada and Australia added about 4% each.
What can other publishers learn from this?
Short answer: Review first, fit the work to the team, plan the first hours of each test article, and watch how concentrated the clicks are.
- Review first, then test. A technical and content review took twelve days and set the priorities. The main finding was that the problems were content-led rather than technical.
- Fit the work to the team. Nothing here required a second newsroom. Discover work was folded into daily publishing.
- Prune what does not belong. The review flagged thin indexed pages and off-topic pages as the first clean-up.
- Plan the first hours. The early-engagement plan covered publish times, homepage pinning, internal links and image size.
- Give it time. The 13 weeks to early October brought about 470,000 Discover clicks, against 2,426 in the three months from December to February.
- Watch concentration. The top 10 pages earned 35.4% of Discover clicks, and a few days carried some months.
What is next
- Confirm monthly Discover revenue and visitors with the publisher's analytics, to replace the estimate.
- Compare titles and images on the stories with the most impressions and the lowest CTR.
- Test more of the planned personal-story formats now that news stories have shown what the audience responds to.
- Trial push notifications and Web Stories, and keep tracking Google’s Discover updates.
Frequently asked questions
How long until Discover traffic shows up?
Here, about ten weeks from kickoff to the first breakout article, no zero-click days from April, and the first month above 100,000 clicks in June, the seventh month after kickoff.
How is the revenue figure calculated?
It is an estimate, not reported earnings. We take the Discover clicks from Google Search Console, divide by 1,000 and multiply by an assumed RPM of $30 to $50, which gives a range. The publisher has not shared its actual Discover revenue with us for this page.
Did you write the content?
No. The publisher's editors wrote it. We supplied research, structures, titles and tooling.
Is this about evergreen guides?
No. The top stories were news and human-interest stories. Evergreen pages earned far less Discover traffic.
Does this work for any publisher?
No. It suits publishers with topical depth, a working editorial process and enough content to test with.
Is the publisher in this case study a real site?
Yes. It is an established running and fitness publisher with a daily news operation. It stays anonymous, so we do not name the site, its pages or its people. The Discover figures come from its own Google Search Console Discover report.
Did your work cause all of the growth?
We can't prove that. Discover is volatile and Google changed it during the period. This page describes what happened, not proven cause.
What this means for your site
This publisher got 1,342 Discover clicks in the month before PIB started and 220,042 in its best full month, an estimated $6.6K to $11.0K at a $30 to $50 RPM. The monthly cards above show every month in between.
If your site has topical depth, a working editorial process and enough content to test with, Google Discover management is built for that: a Search Console audit first, then testing inside your existing workflow.
A call is how you find out whether your site qualifies.
Notes and definitions
- Discover clicks, impressions and CTR come from the Discover performance report in Google Search Console. Clicks are not the same as unique visitors. Months are calendar months. October 2026 covers 1 to 27 October only, so it is not compared with full months.
- Before PIB. The month before PIB is November 2025. The agreement was signed on 27 November 2025 and kickoff was 10 December 2025. November 2025 is the first month of the export used for this page. September 2026 is the best full month; the 164× is 220,042 divided by 1,342.
- Estimated revenue is Discover clicks divided by 1,000, times an assumed RPM of $30 to $50. The publisher has not shared its reported Discover earnings for this page, so every dollar figure is an estimate and your RPM may be higher or lower.
- Page-level figures use the page table for the same period, which sums to about 2% less than the daily chart. That is normal for Search Console. The weekly chart and the 13-week figures (5 July to 5 October 2026) are weekly totals built by PIB from the daily Search Console data.
- Updated. 5 November 2026, with Search Console data to 27 October 2026.
- Not proven cause. Discover is volatile and Google changed it during the period. We cannot prove that any single action caused any single result. Before-and-after comparisons describe the period.
- Anonymised. The publisher is not named and site details are removed from the screenshots.
Is your site a fit for Google Discover?
Book a Google Discover call to see whether Google Discover management could work for your site.
Book a Google Discover callNo upfront cost.