Search across our learning center -- articles, newsletters, and more. Start typing or click a topic above.
Stay in the Loop
Get exclusive publishing strategies, industry insights, and early access to new features. No spam -- just signal.
Join 2,000+ publishers. Unsubscribe anytime.
Industry News
Facebook Content Monetization Weekly Digest: Photos Outpace Reels, $90 Website RPM, and What the Widely Viewed Content Report Tells Publishers
Publisher In a Box11 min read
Table of Contents
This article is part of our daily digest series, in-depth summaries drawn from our X account, @publisherinabox, expanded with industry data. (weekend recap)
The payout that rewrites the format debate: $8,235 and photos beat Reels 5-to-1
The most-shared data point from our feed this weekend came from a real publisher dashboard, $8,235.75 earned from Facebook Content Monetization in a single cycle, on the back of 40 million views that were up 93% from the prior period. That number alone is worth studying, but the media-type breakdown is where the real lesson lives.
Photos generated $5,223.13. Reels generated $943.27. An extra performance bonus added $2,063. On this page, photos out-earned Reels by more than five to one. That single ratio dismantles the working assumption most operators carry into their content calendars, that short-form video is automatically the highest-yield format on Facebook.
The unified Content Monetization Program (CMP) that Meta rolled out through 2025 is the structural reason this is possible. FBEarningCalculator notes that by August 31, 2025, the CMP fully replaced In-Stream Ads, Ads on Reels, and the standalone Performance Bonus program, consolidating all formats under one payout logic. That means photos, text posts, and long-form video all contribute to the same monthly number, and which format wins depends entirely on how your specific audience engages, not on a platform-wide hierarchy.
Real publisher dashboard: $8,235.75 in one Content Monetization cycle, photos ($5,223) beat Reels ($943) by more than 5xPhotos generated more than five times the revenue of Reels in this real payout cycle
Format strategy is one of the core areas our team addresses in Facebook consulting engagements, because the right answer is never universal, and these dashboards prove it.
Two monetization approvals from the WhatsApp community, and why the wait varies so much
Two separate approval stories surfaced in our community this weekend. The first came from a publisher who ran two pages through what we call the 300k challenge. Both landed a Content Monetization invite. One arrived the same day the challenge was completed.
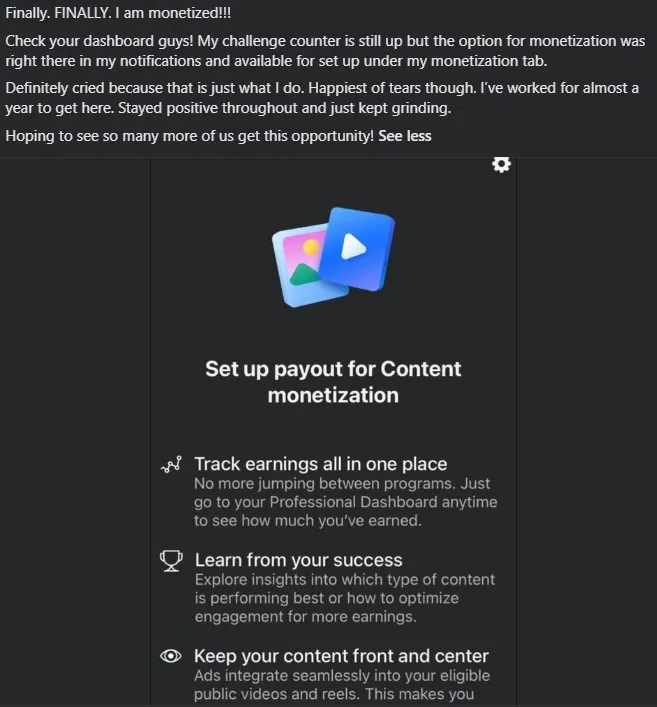
A publisher in our WhatsApp community hit the "Welcome to content monetization" screen after running two pages through the 300k challenge
The second story was a sharper contrast. A publisher kept posting consistently for almost a full year before the "Set up payout for Content monetization" option appeared in their dashboard. That timeline is longer than it needs to be, and it underscores a point we return to repeatedly: patience alone is not a strategy. The publishers reaching approval the fastest are the ones operating with a structured, repeatable content system, not grinding volume and hoping the tab appears.
After almost a year of consistent posting, the monetization payout option finally appeared, a timeline that structured operators shorten significantly
Meta's ad business is expanding the pool of revenue available to creators. Meta's Q2 2026 earnings release reported advertising revenue of $59.36 billion, up 27% year over year, with ad impressions rising 14% and average price per ad rising 12%. That is the macro tide lifting payout potential for every approved page. Getting approved, and staying approved, is the entry fee. If you want guidance on building the operational system that gets you there, our Facebook turnkey management service is built around exactly that outcome.
What a $90 website RPM tells us about niche and placement discipline
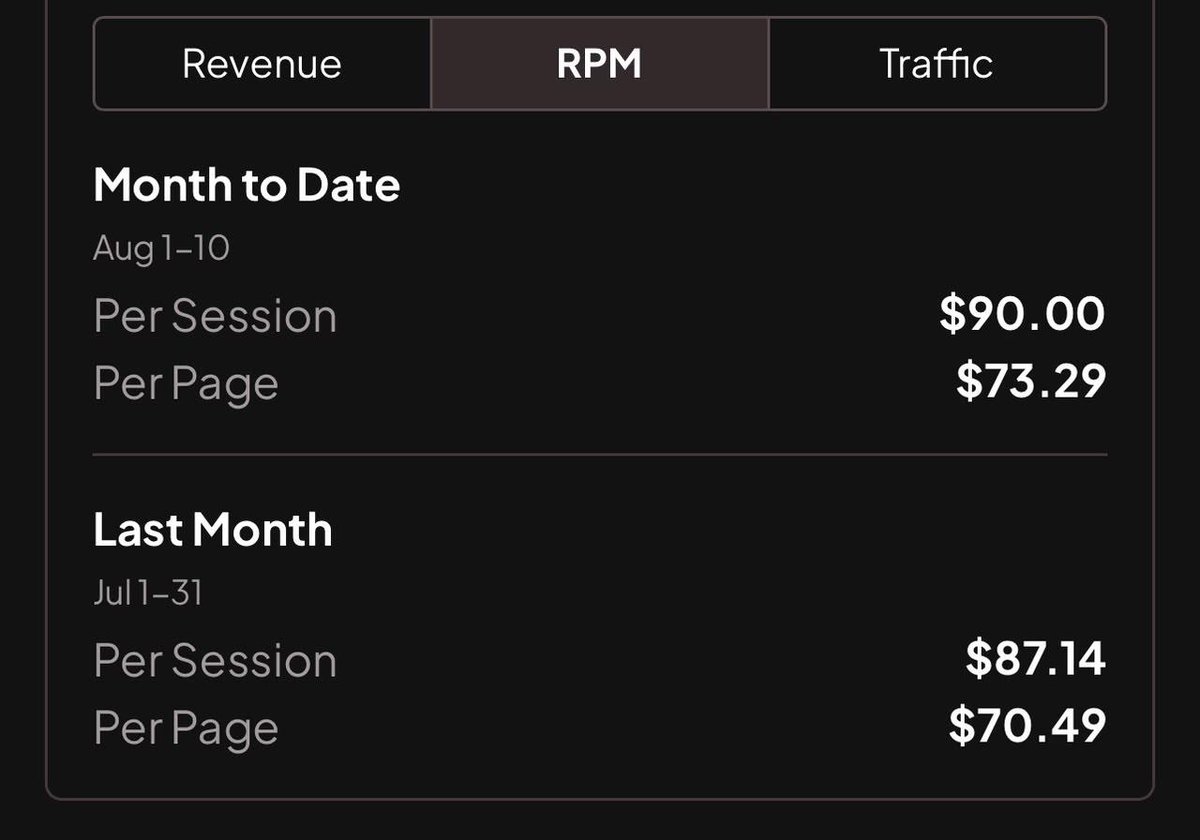
One of the highest-engagement posts of the weekend showed a real publisher website dashboard: $90.00 revenue per thousand sessions month-to-date for August 1, 10, with last month holding at $87.14. These figures are not anomalies for publishers who have matched premium ad placements with the right niche.
A real publisher dashboard: $90 RPM on sessions for August 1, 10, holding near $87 the prior month
Context matters here. Google Search referral traffic to small publishers fell 60% in the period from December 2024 to December 2025, according to Chartbeat data reported by Axios in March 2026. Publishers who built traffic dependency on a single channel are feeling that acutely. The $90 RPM result belongs to a publisher who clearly built something more durable, traffic quality and ad placement discipline that compounds regardless of search volatility.
Google Discover remains one of the few free-growth channels that can offset search losses. According to Digiday, click-through rates in Discover were four times higher than Google Search rates in Q1 2025, and Chartbeat data showed roughly a 6% increase in Discover traffic even as Search pageviews fell 9% in the same period. A full Discover audit, reading your Search Console, identifying what is blocking distribution, and building a prioritized fix list, is one of the highest-return diagnostic exercises an independent publisher can run right now.
Meta's Widely Viewed Content Report: what the link-post data means for publishers
Meta publishes a quarterly Widely Viewed Content Report that breaks down what people see in Facebook Feed, including a dedicated category for posts that contain an external link. The latest edition covering Q4 2025 makes the situation clear: Meta's Transparency Center reports that 98.5% of views in the US during Q4 2025 did not include a link to a source outside of Facebook, and for the 1.5% of views that did include a link, they typically came from a Page the person followed.
That figure has moved meaningfully over time. Social Media Today noted that the link-post reach share has declined from 9.8% back in 2022, when Meta first began publishing this data, to the current 1.5% range. The trajectory is not ambiguous. Facebook's algorithm has been systematically reducing distribution for posts that pull users off the platform.
For publishers, this is not a reason to abandon link posts, it is a reason to be precise about when and how they are deployed. The Widely Viewed Content Report tracks link posts as their own content type, which means Meta is measuring and categorizing this format specifically. Understanding how that categorization interacts with your page's content mix is part of what separates operators who grow from operators who plateau.
The AI visibility trust gap: a survey that every publisher building for GEO should read
A survey by Duane Forrester of 163 professionals working on AI visibility found that almost nobody selling AI visibility metrics has earned the trust of the people buying them. That finding resonated across our feed this weekend because it describes a real operational problem: publishers and brands are spending real budget on AI visibility platforms at the exact moment those platforms are least standardized.
The broader data supports the skepticism. Search Engine Land reported that in 2025, 82% of consumers found AI search more helpful than traditional search results. By 2026, that figure had dropped to 54%, a 28-percentage-point decline in a single year, driven primarily by hallucination fatigue. The category of AI search itself is losing user trust at the same time AI visibility platforms are asking publishers to trust their measurement.
WordPress VIP's 2026 Future of the Web research put it plainly: "The category is too new and the measurement tools are too immature." Platforms cite different sources for different queries, citations change as models update, and the metrics enterprise teams use to track AI visibility are not standardized across vendors. For publishers evaluating these tools, Forrester's survey is the context to hold before committing to any platform's numbers.
The practical read for Facebook page operators is narrower but no less important: AI visibility is a secondary concern compared to owning the distribution channels you can control and measure. Digiday has documented that publishers have seen anywhere from 15% to 40% referral traffic declines from Google over the past year. Facebook page monetization, combined with a Google Discover presence, offers a traffic and revenue structure that does not depend on winning an AI citation lottery.
Why the photos-vs-Reels result connects to every other story this week
Step back from the individual posts and a single principle connects all of them: the operators with the best outcomes are the ones who test actual data from their own pages rather than applying platform-wide assumptions.
The publisher earning $8,235 tested format mix and found photos dominate. The publisher hitting $90 session RPM built niche depth and placement discipline rather than chasing volume. The two 300k challenge winners followed a repeatable system rather than posting randomly. And the publishers who will navigate the AI visibility measurement chaos most effectively are the ones who stay grounded in metrics they can verify, Facebook monetization dashboards, Search Console data, and real session RPM figures, rather than third-party scores with no audit trail.
Digiday's Chartbeat analysis showed that Google Search pageviews fell roughly 9% from January to April 2025 while Discover traffic rose about 6% in the same window. That divergence is still playing out. Publishers who are building on Facebook and Discover simultaneously are positioning across the two non-search channels with the clearest data feedback loops available right now.
If you are at the stage of deciding how to structure that build, whether to approach it as a consulting engagement or a fully managed operation, our Facebook consulting and turnkey management pages lay out how we think about both paths.
Frequently asked questions
Why do photos sometimes out-earn Reels on Facebook Content Monetization? The unified Content Monetization Program pays based on overall content performance across all formats, not on a fixed per-format rate. If your audience engages more deeply with photo posts, through comments, shares, and sustained attention, those posts can generate more qualifying views and higher ad revenue than Reels. The $8,235 payout breakdown we shared this weekend, where photos earned $5,223 against $943 for Reels, is a real-world illustration of how much format performance varies by page and niche.
How long does Facebook Content Monetization approval typically take? Approval timelines range widely. Some publishers in our community received the invite the same day they completed a structured growth milestone. Others posted consistently for close to a year before seeing the monetization tab appear. The difference typically comes down to whether the page is growing with a system, consistent posting cadence, strong engagement signals, and no policy strikes, or accumulating time without hitting Meta's performance thresholds.
What does Meta's Widely Viewed Content Report show about link posts on Facebook? Meta's Q4 2025 Widely Viewed Content Report shows that 98.5% of US Feed views did not include an external link, meaning link posts account for only 1.5% of total views. This share has declined from 9.8% in 2022. The report tracks link posts as a separate content type, which signals that Meta's algorithm actively deprioritizes off-platform link distribution relative to native content formats.
What is a realistic website session RPM for publishers using premium ad placements? Session RPM varies significantly by niche, geography, and ad setup. The dashboard we shared shows $90 per thousand sessions for a US-focused publisher in a premium niche with optimized ad placements. That figure is not typical across all publishers, but it is achievable for sites that have matched the right niche with premium demand partners and placement discipline. More commonly, well-optimized general publishers operate in the $20 to $50 RPM range.
Should publishers trust AI visibility platform data right now? The honest answer is: with significant caution. A survey of 163 AI visibility professionals by Duane Forrester found that trust in platform-reported metrics is low across the industry. WordPress VIP's 2026 research noted that citations change as models update and that metrics are not standardized across vendors. For publishers, this means AI visibility data should be treated as directional rather than definitive, and decisions about content investment should continue to be anchored in verifiable metrics like Search Console data, session RPM, and Facebook monetization dashboards.
See more from Publisher in a Box in your Google results
The team behind 300M+ managed followers. We help publishers scale traffic, revenue, and audience across Facebook, Google Discover, and syndication networks.