Where the pages started
When the publisher came to PIB, the Facebook pages were clean and compliant, but stuck. Posting leaned on recycled schedules and link-in-comment posts, and the pages with big followings earned little from them.
Live case study · Facebook Managed Distribution
Site ad revenue from Facebook traffic, September 2026
$153.7K
April 2026, the go-live month $13.1K in site ads
An established gardening and homesteading publisher, and what Facebook traffic earned it month by month after PIB took over day-to-day distribution of its 16 Facebook pages under Facebook Managed Distribution (turnkey management).
Source: ad network dashboard, revenue from Facebook traffic. Content Monetization from Meta payout statements. Rounded. Notes and definitions. Updated 9 November 2026.
The partnership has been going amazingly. I honestly didn’t think Facebook traffic could grow to what it has. It’s really becoming consistent as well, which is important.
Short answer: In September 2026 Facebook traffic earned the publisher $153.7K in site ads, about 11.7 times April's $13.1K, with another $12.2K of Content Monetization on top. October fell to $81.7K as the season turned, still about 6 times April. Treat it as one publisher's results, not a promise.
Facebook traffic by month, April to October 2026
Hover, tap or tab to a month for exact figures.
Site ads from Facebook trafficContent Monetization on topNo Content Monetization figure (June, October): site ads only
| Month | Site ads | Content Monetization | Sessions | Session RPM |
|---|---|---|---|---|
| April 2026 | $13,140 | $2,824 | 155,717 | $84.38 |
| May 2026 | $78,920 | $6,426 | 742,825 | $106.24 |
| June 2026 | $113,985 | no figure | 1,107,262 | $102.94 |
| July 2026 | $120,963 | $9,484 | 1,327,032 | $91.15 |
| August 2026 | $120,683 | $8,369 | 1,445,318 | $83.49 |
| September 2026 | $153,731 | $12,245 | 1,635,666 | $93.98 |
| October 2026 | $81,712 | no figure | 971,149 | $84.13 |
Site ads from Facebook traffic, April to October
September 2026$153,731 site ads1.64M sessions$93.98 per 1,000 sessions
September was the peak. October fell as gardening moved out of season, and we show it as it is.
16 pages, one site
Hover or tap a page. Figures are PIB-tagged per-page income for September.
Node size is each page’s September PIB-tagged income. Pages are labelled A to P.
Readers who come from Facebook earn on the site through ads. The pages themselves also earn from Facebook Content Monetization. Pick a month, then a stream. Only months with a Content Monetization figure are shown.
Share of each month’s Facebook revenue
Site ads were about 12 to 14 times Content Monetization from May to September, and about 5 times in April. June and October have no Content Monetization figure, so they appear only as site ads in the chart above. Teal is Content Monetization, amber is site ads.
Facebook traffic only, April to October. Each card shows what we did and what happened. The small bars show site ads for all seven months, with this month highlighted.
Content Monetization is the part Meta pays to the pages directly. These are the September 2026 payouts, as the payout list shows them.
Total, 16 pages$12,245.41
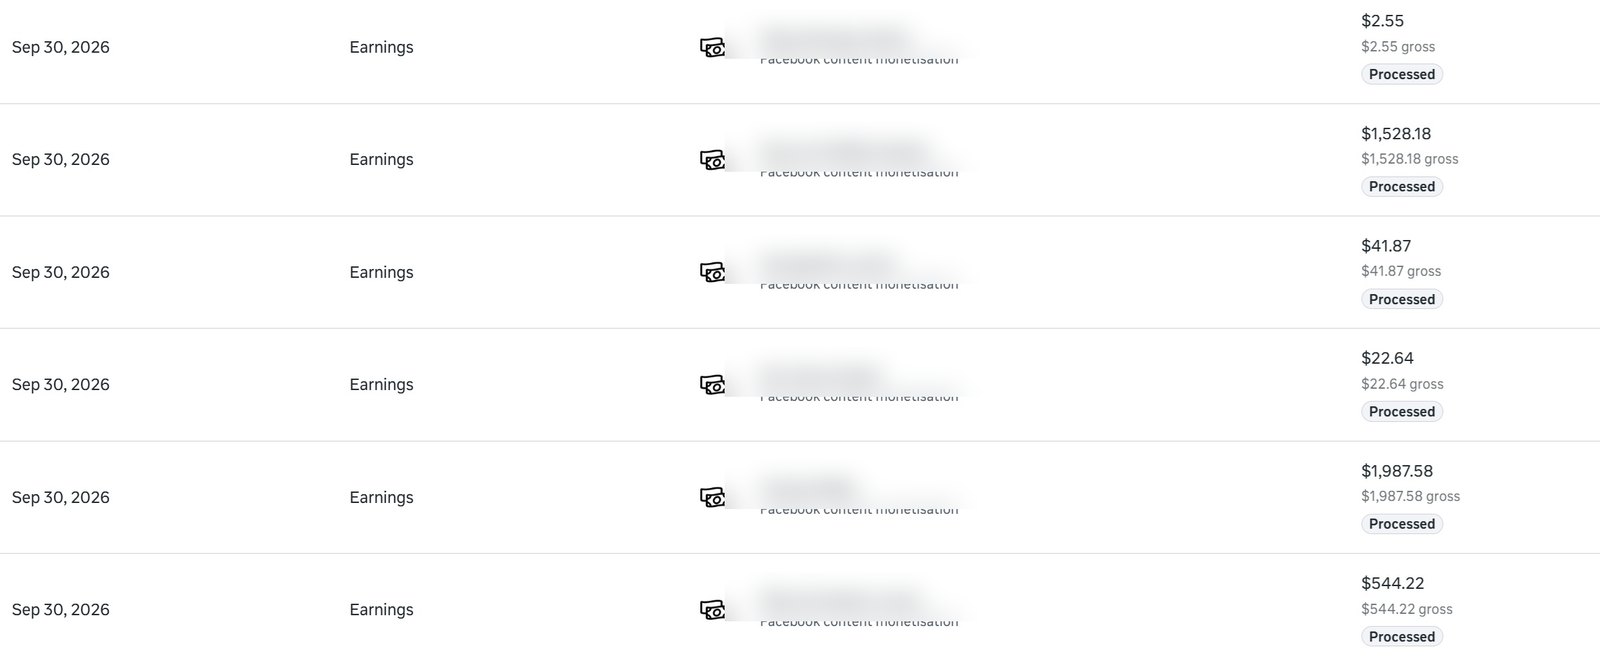
Six payout rows dated 30 September 2026: $2.55, $1,528.18, $41.87, $22.64, $1,987.58 and $544.22.
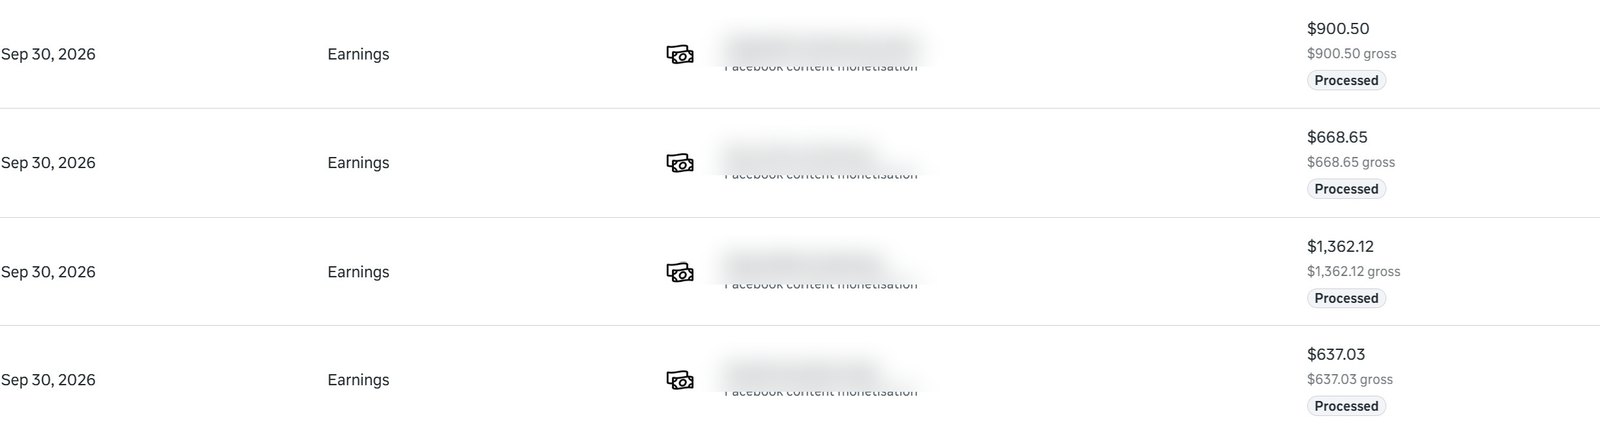
Four more rows from the same list: $900.50, $668.65, $1,362.12 and $637.03.
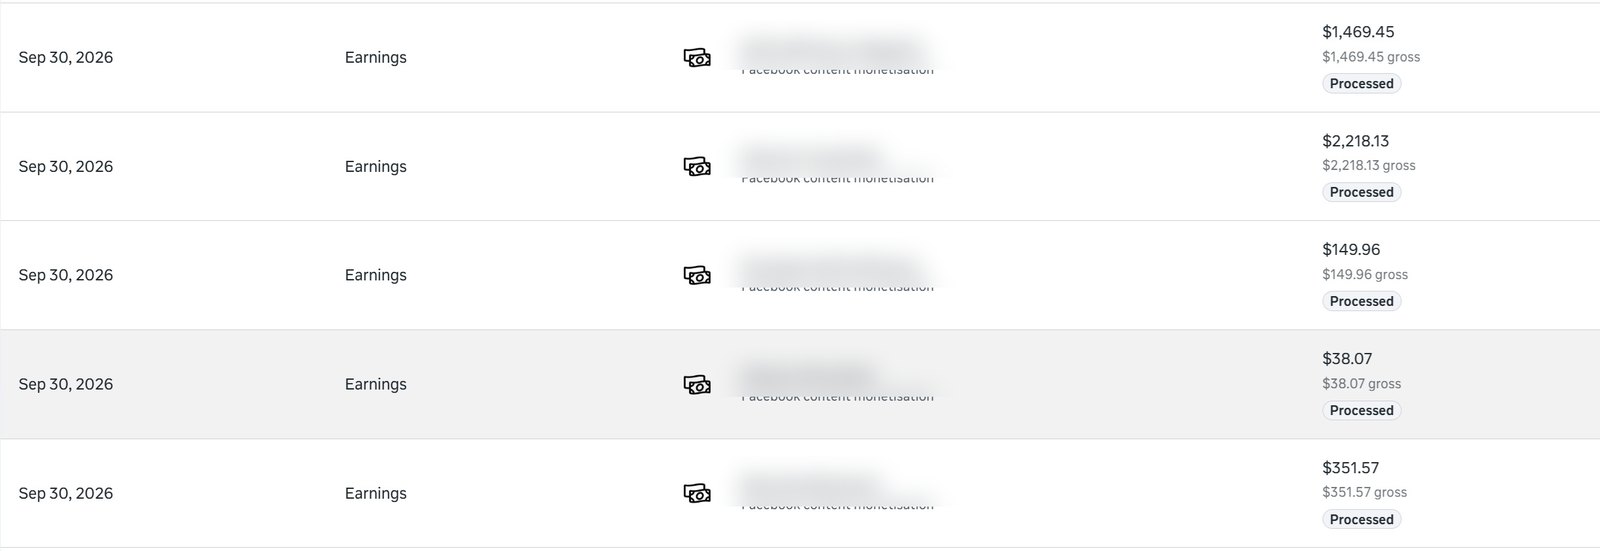
Five more rows: $1,469.45, $2,218.13, $149.96, $38.07 and $351.57. Page names are blurred in all three screenshots.
The three screenshots show 15 of the 16 pages. The sixteenth payout, $322.89, is in the ledger and the total but not pictured.
Short answer: PIB took over day-to-day posting on 16 of the publisher's Facebook pages. It replaced recycled, link-in-comment schedules with fresh on-niche posts at higher volume, matched content to the growing season, tracked every page with UTM tags, and earned twice from each audience: Content Monetization plus site display ads.
16 Facebook pages
PIB plans, writes and schedules the posts
One publisher site
1.64M
Facebook sessions in September
Two income streams
$153.7KSite ads
$12.2KContent Monetization
September 2026, $166.0K in all
When the publisher came to PIB, the Facebook pages were clean and compliant, but stuck. Posting leaned on recycled schedules and link-in-comment posts, and the pages with big followings earned little from them.
16 pages, labelled Page A to Page P in this case study. Follower counts run from about 15K to about 900K across the pages. See how PIB runs home and gardening Facebook pages.
Short answer: Our policy is to stop investing in pages that don't clear a cost bar. The bar was about $500 a month per page, once the per-page Meta One subscription and team time were counted. Meta One has since raised the bar. Every page got about six months first, and the growth came with all 16 running.
The rule PIB uses now:
Short answer: Not in this network. In September 2026, the largest page (700K to 800K) earned about $4.1K and ranked 12th of 16, a 500K to 600K page ranked 14th at about $149, and pages with 100K to 200K followers earned up to about $12.9K. One page with 300K to 400K followers was under the $500 bar in July 2026 and was the fourth-best page by September.
Here is what all 16 pages (Pages A to P) earned (PIB-tagged site ad revenue plus Content Monetization). These per-page figures count only PIB-tagged traffic, so they sit below the monthly Facebook totals above. Pages are anonymised and follower counts are shown as bands.
300K to 400K followers at onboarding. Select a bubble to change this card.
The dashed line marks the $500 bar for one month.
| Page | Followers (at start) | Jul 2026 | Aug 2026 | Sep 2026 |
|---|---|---|---|---|
| Page A | 300K to 400K | $9.7K | $16.1K | $19.3K |
| Page B | 300K to 400K | $3.1K | $11.3K | $16.7K |
| Page C | 300K to 400K | $8.1K | $11.4K | $8.5K |
| Page D | 100K to 200K | $6.4K | $8.4K | $12.9K |
| Page E | 200K to 300K | $3.4K | $7.9K | $14.7K |
| Page F | 400K to 500K | $8.9K | $7.6K | $6.3K |
| Page G | 300K to 400K | $483 | $7.3K | $14.3K |
| Page H | 100K to 200K | $2.9K | $7.9K | $7.8K |
| Page I | 700K to 800K | $8.6K | $2.8K | $4.1K |
| Page J | 100K to 200K | $2.2K | $2.1K | $7.2K |
| Page K | 300K to 400K | $805 | $882 | $6.4K |
| Page L | 100K to 200K | $694 | $2.6K | $4.6K |
| Page M | 200K to 300K | $82 | $165 | $266 |
| Page N | 500K to 600K | $146 | $206 | $149 |
| Page O | 300K to 400K | $67 | $91 | $49 |
| Page P | 200K to 300K | $28 | $30 | $18 |
Follower band for Page P is from November 2026. The others are from February 2026, at onboarding.
Bigger pages did not earn more. The page with the largest following in the table, Page I (700K to 800K followers), ranked 12th of 16 in September and earned about $4.1K, while Page N (500K to 600K) ranked 14th at about $149. Pages H and J (100K to 200K) ranked 7th and 8th.
Slow starters became top earners. Page G was under the bar in July, then climbed to fourth by September. Page K went from just over the bar in July to ninth.
If we had stopped investing on July's numbers, we would have walked away from the page that became number four.
Earnings concentrate. In September the top five pages produced 63% of the per-page total across all 16 pages.
All sixteen pages, ranked. Each bar splits into Content Monetization and referral traffic.
Referral = PIB-tagged sessions × site RPM. July referral is counted on users, not sessions, so July is not strictly comparable.
Short answer: Give every page a real run before judging it, then set an honest cost bar. Track each page with UTM tags. Earn twice from the same audience. And keep an eye on platform policy: Facebook has begun limiting and charging for some link posts, so we briefed the publisher early.
“Even we weren’t expecting these pages to drive this much traffic. You give every page a real shot, then push the assets that work as hard as you possibly can.”
Facebook Managed Distribution (turnkey management)
Short answer: There is no upfront cost. PIB takes a 50% share of the Facebook revenue it manages: Content Monetization on the managed pages plus site ad revenue from the Facebook traffic it sends. It is 100% performance-based. As of October 2026, eligibility is 500K+ Facebook followers or $10K+ a month in revenue.
PIB is a distribution and technology company with a senior team. Under Facebook Managed Distribution (turnkey management), we run day-to-day distribution on your Facebook pages, and you keep ownership of your pages and your site.
Yes. It is an established gardening and homesteading publisher. It stays anonymous by agreement, so we do not name the site, its pages or its owner. Site-ad figures come from the publisher's ad network dashboard, revenue from Facebook traffic. Content Monetization figures come from Meta payout statements.
It is the site ad revenue the ad network dashboard credits to Facebook traffic, month by month, from April to October 2026. In September 2026 that was $153.7K on about 1.64M Facebook sessions. Meta Content Monetization on the managed pages is shown as an extra on top where it is recorded: $12.2K in September. It covers Facebook only.
No. This is one publisher's results, not a promise or a prediction. See Notes and definitions. April, the month PIB went live, had $13.1K of site ads from Facebook traffic. September had $153.7K, about 11.7 times as much. Your pages may earn more or less.
PIB started with 16 pages in April 2026. All 16 ran through September 2026. Our policy is to stop investing in pages that don't clear a cost bar, and Meta One has since raised the bar.
Go-live was 3 April 2026. April site ads from Facebook traffic were $13.1K. May 2026, the first full month, came in at $78.9K, and June passed $100K at $114.0K. September 2026 reached $153.7K.
Facebook traffic fell to about 971K sessions and site ads from it to $81.7K, down 47% from September and still about 6 times April. Part of it is seasonal. As the publisher put it when reviewing this case study, gardening content “isn't as popular during the late fall and winter months.” We show October with the same definitions as every other month.
PIB takes a 50% share of the Facebook revenue it manages, with no upfront cost. That covers Content Monetization on the managed pages and site ad revenue from the Facebook traffic PIB sends, tracked per page with UTM tags. Each invoice comes with a monthly statement.
Publishers and creators with 500K+ Facebook followers, or $10K+ a month in revenue. If you qualify, PIB runs day-to-day distribution on your pages under a 50/50 revenue share, with no upfront cost.
Monthly. Each month we add one month to the Facebook chart and one short card, using the same definitions every time, including in down months.
In September 2026 Facebook traffic earned this publisher $153.7K in site ads on about 1.64M Facebook sessions, with $12.2K of Content Monetization on top. PIB ran the daily posting on 16 of its Facebook pages. The publisher kept the pages and the site.
If you run Facebook pages with 500K+ followers or $10K+ a month in revenue, Facebook Managed Distribution (turnkey management) works the same way: a 50/50 revenue share and no upfront cost.
Your pages may earn more or less than these did. A call is how you find out whether they are eligible.
Rather run it in-house and keep 100% of the revenue? See Facebook consulting. More results: the Google Discover case study.
If you run Facebook pages with 500K+ followers or $10K+ a month in revenue, see if Facebook Managed Distribution (turnkey management) is a fit.
Build my plan50/50 revenue share, no upfront cost. Prefer to talk first? Book a call.